The CS-vs-Liberal-Arts Unemployment Reversal Is Real. It's Not What You Think.
TL;DR
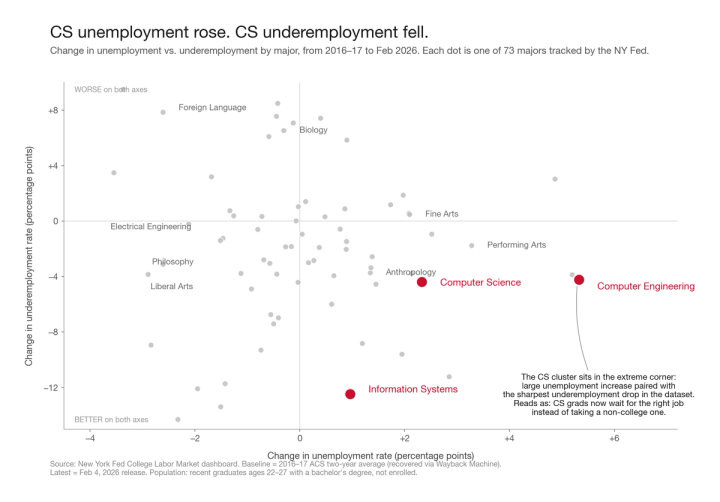
- Computer Science recent-grad unemployment is now 6.99%, vs. 4.47% for the broad liberal arts (humanities + social sciences). The gap reversed by roughly 2.9 pp since the pre-COVID baseline.
- But CS underemployment fell over the same window (27% → 20%), while liberal arts underemployment is still 49%. CS grads aren't being shut out of the labor market; they're waiting for the right job. Liberal arts grads aren't winning. They're taking non-college jobs and dropping out of the unemployment count.
- The reversal is CS-specific. Electrical Engineering improved. Civil and Mechanical were flat. "Tech grads" is the wrong frame. "CS and Computer Engineering" is the right one.
- Cause is dual: CS bachelor's production grew 68% in six years while software-developer hiring grew 19% in ten years (supply overshoot), and the 2022–2024 tech layoff wave flooded entry-level pipelines with experienced workers. Even after hiring resumes, the supply pipeline keeps unemployment elevated through roughly 2027–2029.
The headline claim, tested
The viral version: "CS grads now have higher unemployment than Art History grads." I wanted to know if that's actually true, and if so, what it means.
The right source is the New York Fed's College Labor Market dashboard, which tracks recent graduates ages 22–27 with a bachelor's degree, not enrolled in further schooling. The current release (Feb 4, 2026) publishes the latest cross-section. For the pre-COVID baseline I pulled archived snapshots of the dashboard's underlying data file from the Wayback Machine: four independent captures between September 2019 and May 2020, all serving the same 73-major payload labeled as the 2016–17 ACS two-year average. That's the last by-major snapshot the Fed published before COVID, so it's the right pre-shock anchor.
What actually happened to CS
| Cohort | 2016–17 | Feb 2026 | Δ (pp) |
|---|---|---|---|
| Computer Science | 4.67% | 6.99% | +2.33 |
| Computer Engineering | 2.46% | 7.78% | +5.32 |
| Information Systems | 5.02% | 5.98% | +0.96 |
| CS/IT cluster avg | 4.05% | 6.92% | +2.87 |
Computer Engineering's swing is the largest of any major in the entire 73-major dataset. CS is fourth. The "CS-and-tech grads are getting crushed" narrative survives contact with the data.
What actually happened to liberal arts
| Cohort | 2016–17 | Feb 2026 | Δ (pp) |
|---|---|---|---|
| Humanities (10 majors) | 4.53% | 4.93% | +0.40 |
| Social Sciences (11 majors) | 4.36% | 4.05% | −0.31 |
| Liberal Arts BROAD (21 majors) | 4.44% | 4.47% | +0.03 |
Liberal arts unemployment didn't fall. It held flat. The popular framing — "humanities are surging while tech collapses" — is wrong. Liberal arts didn't beat CS by getting better. CS got worse and crossed past them.
The CS-minus-LA gap moved from −0.4 pp (CS slightly below LA) to +2.5 pp (CS well above). Net swing: ~2.9 pp.
Where the headline is wrong
Now the part that gets left out of every viral post.
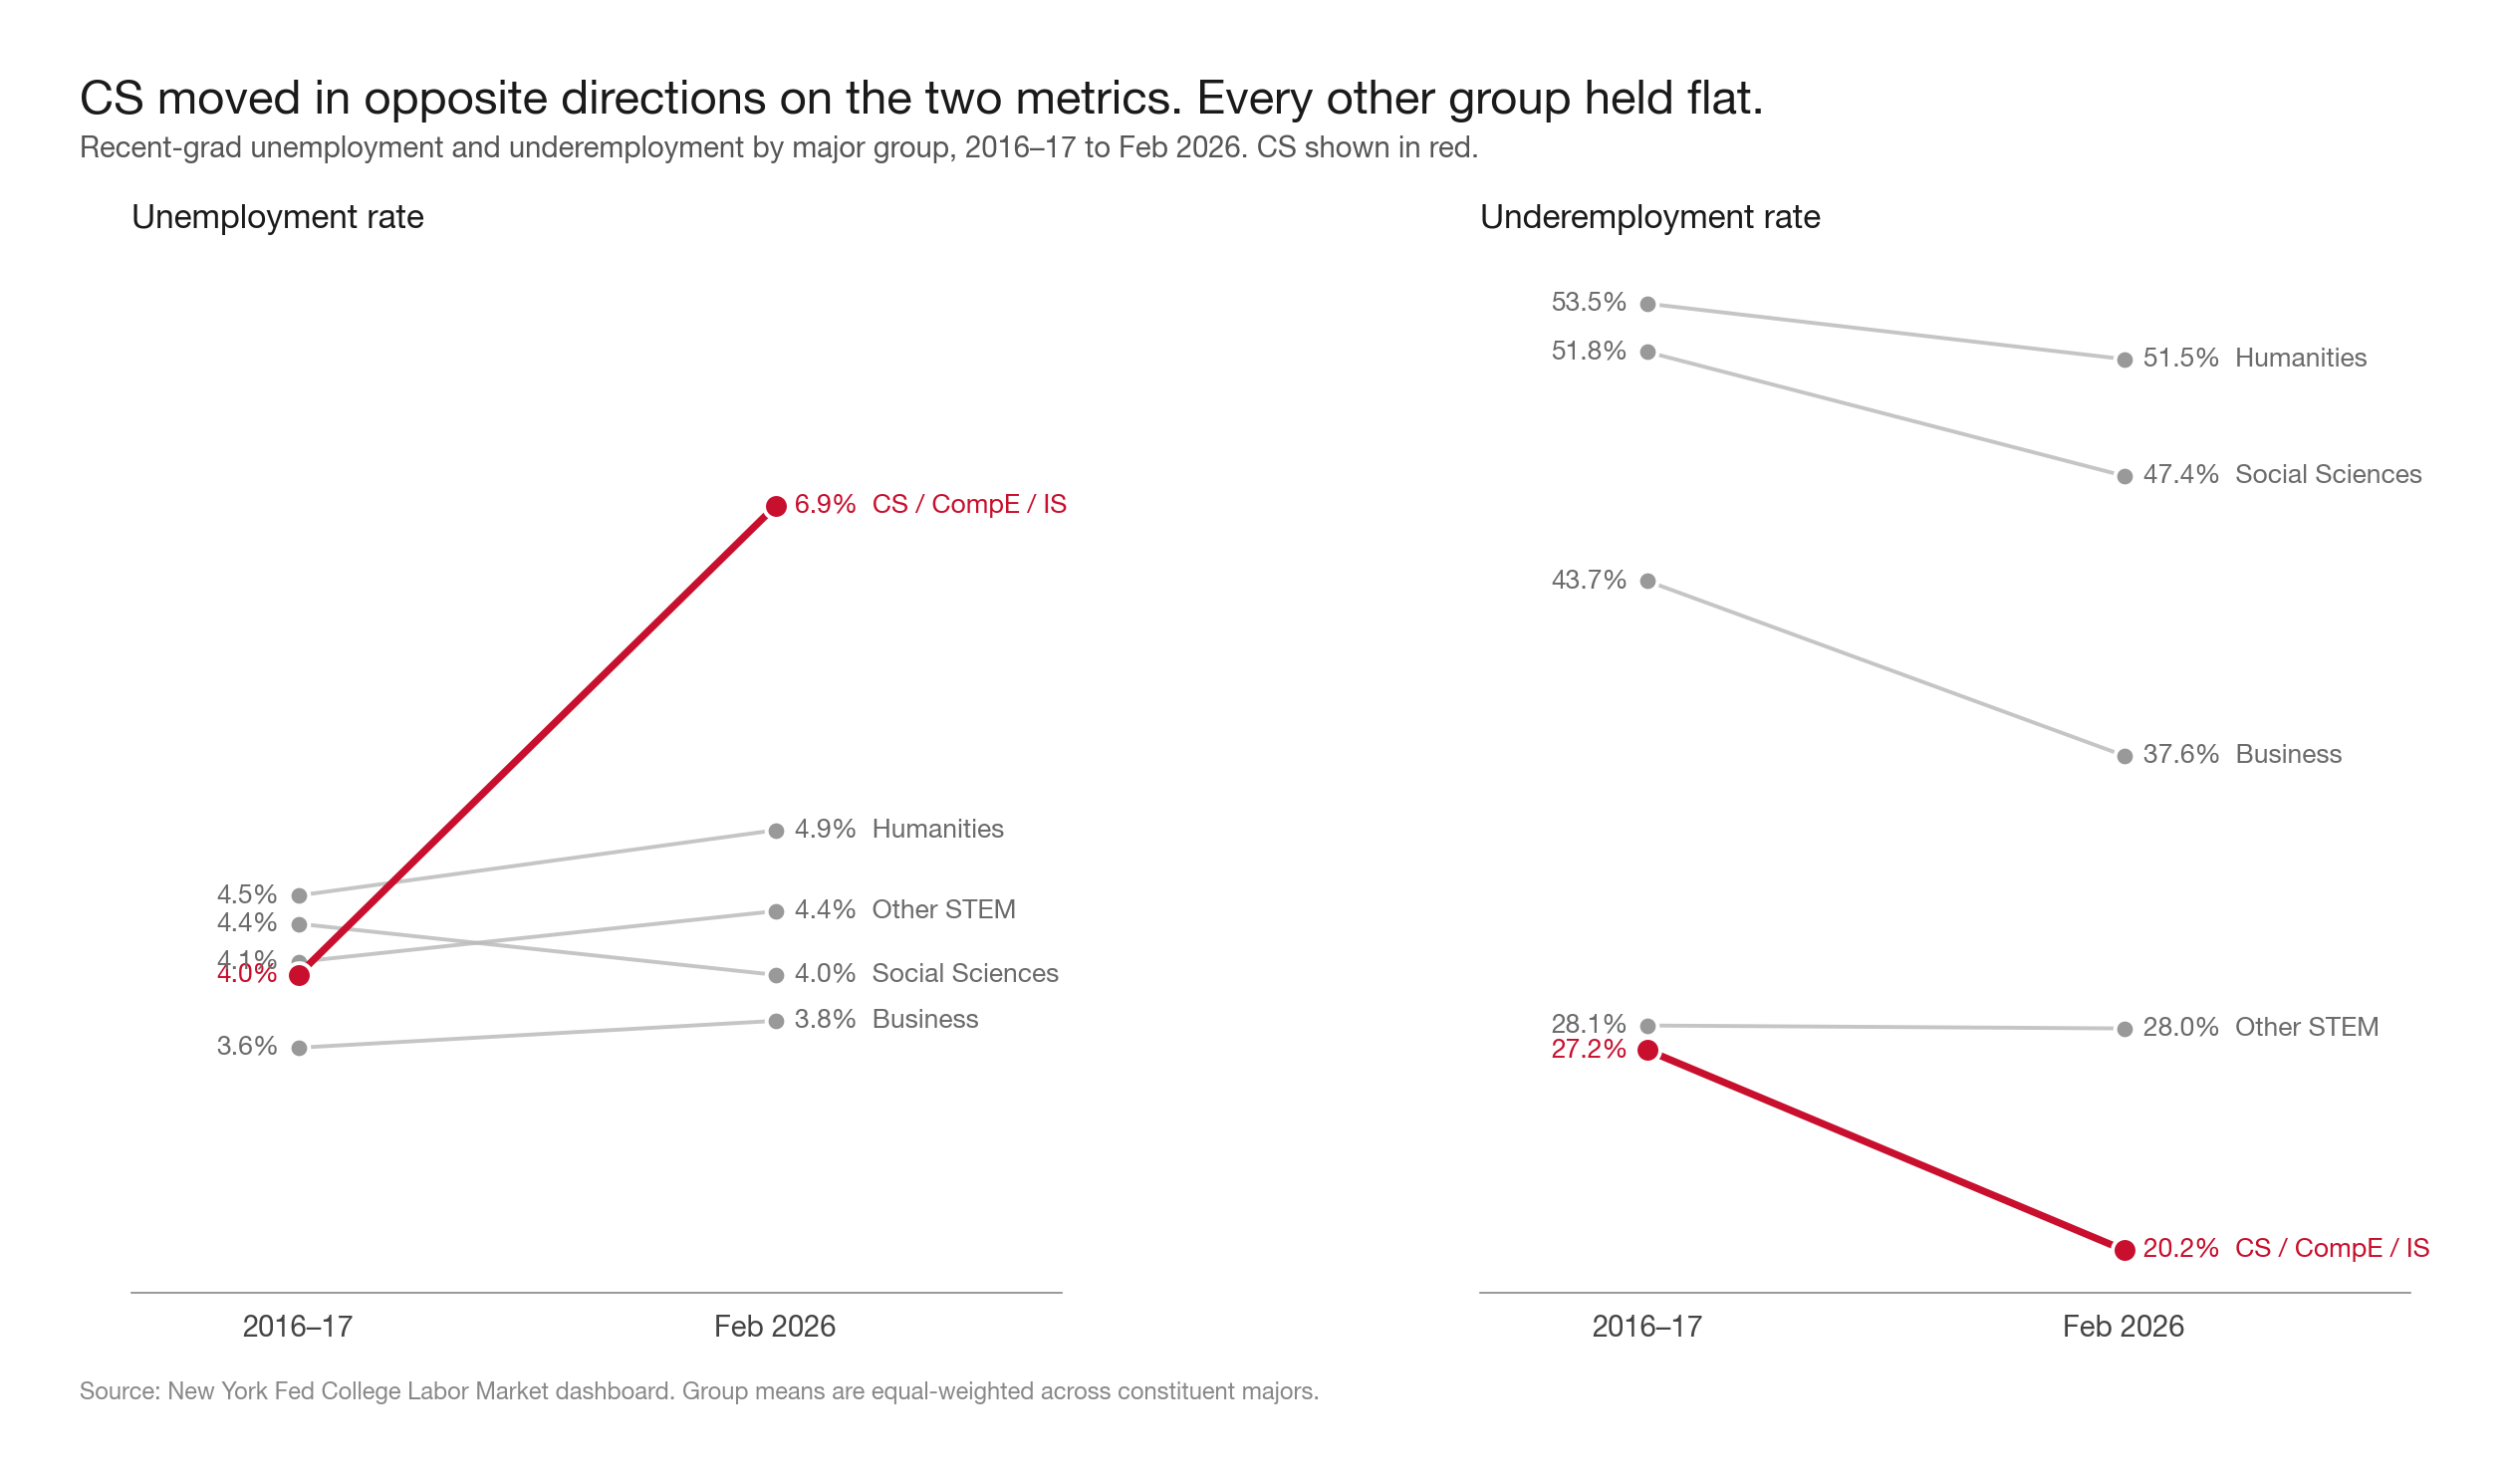
CS underemployment fell from 27.2% to 20.2%, down 7 pp. Liberal arts underemployment is 49.4%, more than 2x higher than CS. The full table:
| Cohort | Underemp 2016–17 | Underemp Feb 2026 | Δ |
|---|---|---|---|
| CS/IT cluster | 27.2% | 20.2% | −7.0 |
| Other STEM | 28.1% | 28.0% | −0.1 |
| Humanities | 53.5% | 51.5% | −2.0 |
| Social Sciences | 51.8% | 47.4% | −4.4 |
| Liberal Arts broad | 52.6% | 49.4% | −3.2 |
So CS unemployment went up while CS underemployment went down. Both moving in opposite directions only fits one story: CS grads are choosing to stay unemployed rather than take a non-college job. They have a high reservation wage and they're willing to wait.
This isn't speculation. It's exactly what statisticians call a collider bias on the unemployment-rate comparison. CS grads stay in the "looking for a CS job" pool longer because the payoff is large: CS early-career median wage is $87K vs. $45K for the average humanities major, roughly 80% wage premium. Liberal arts grads in the same spot exit the unemployment count by accepting a barista job, a service-sector job, an admin job, all of which count as "employed" in the headline number.

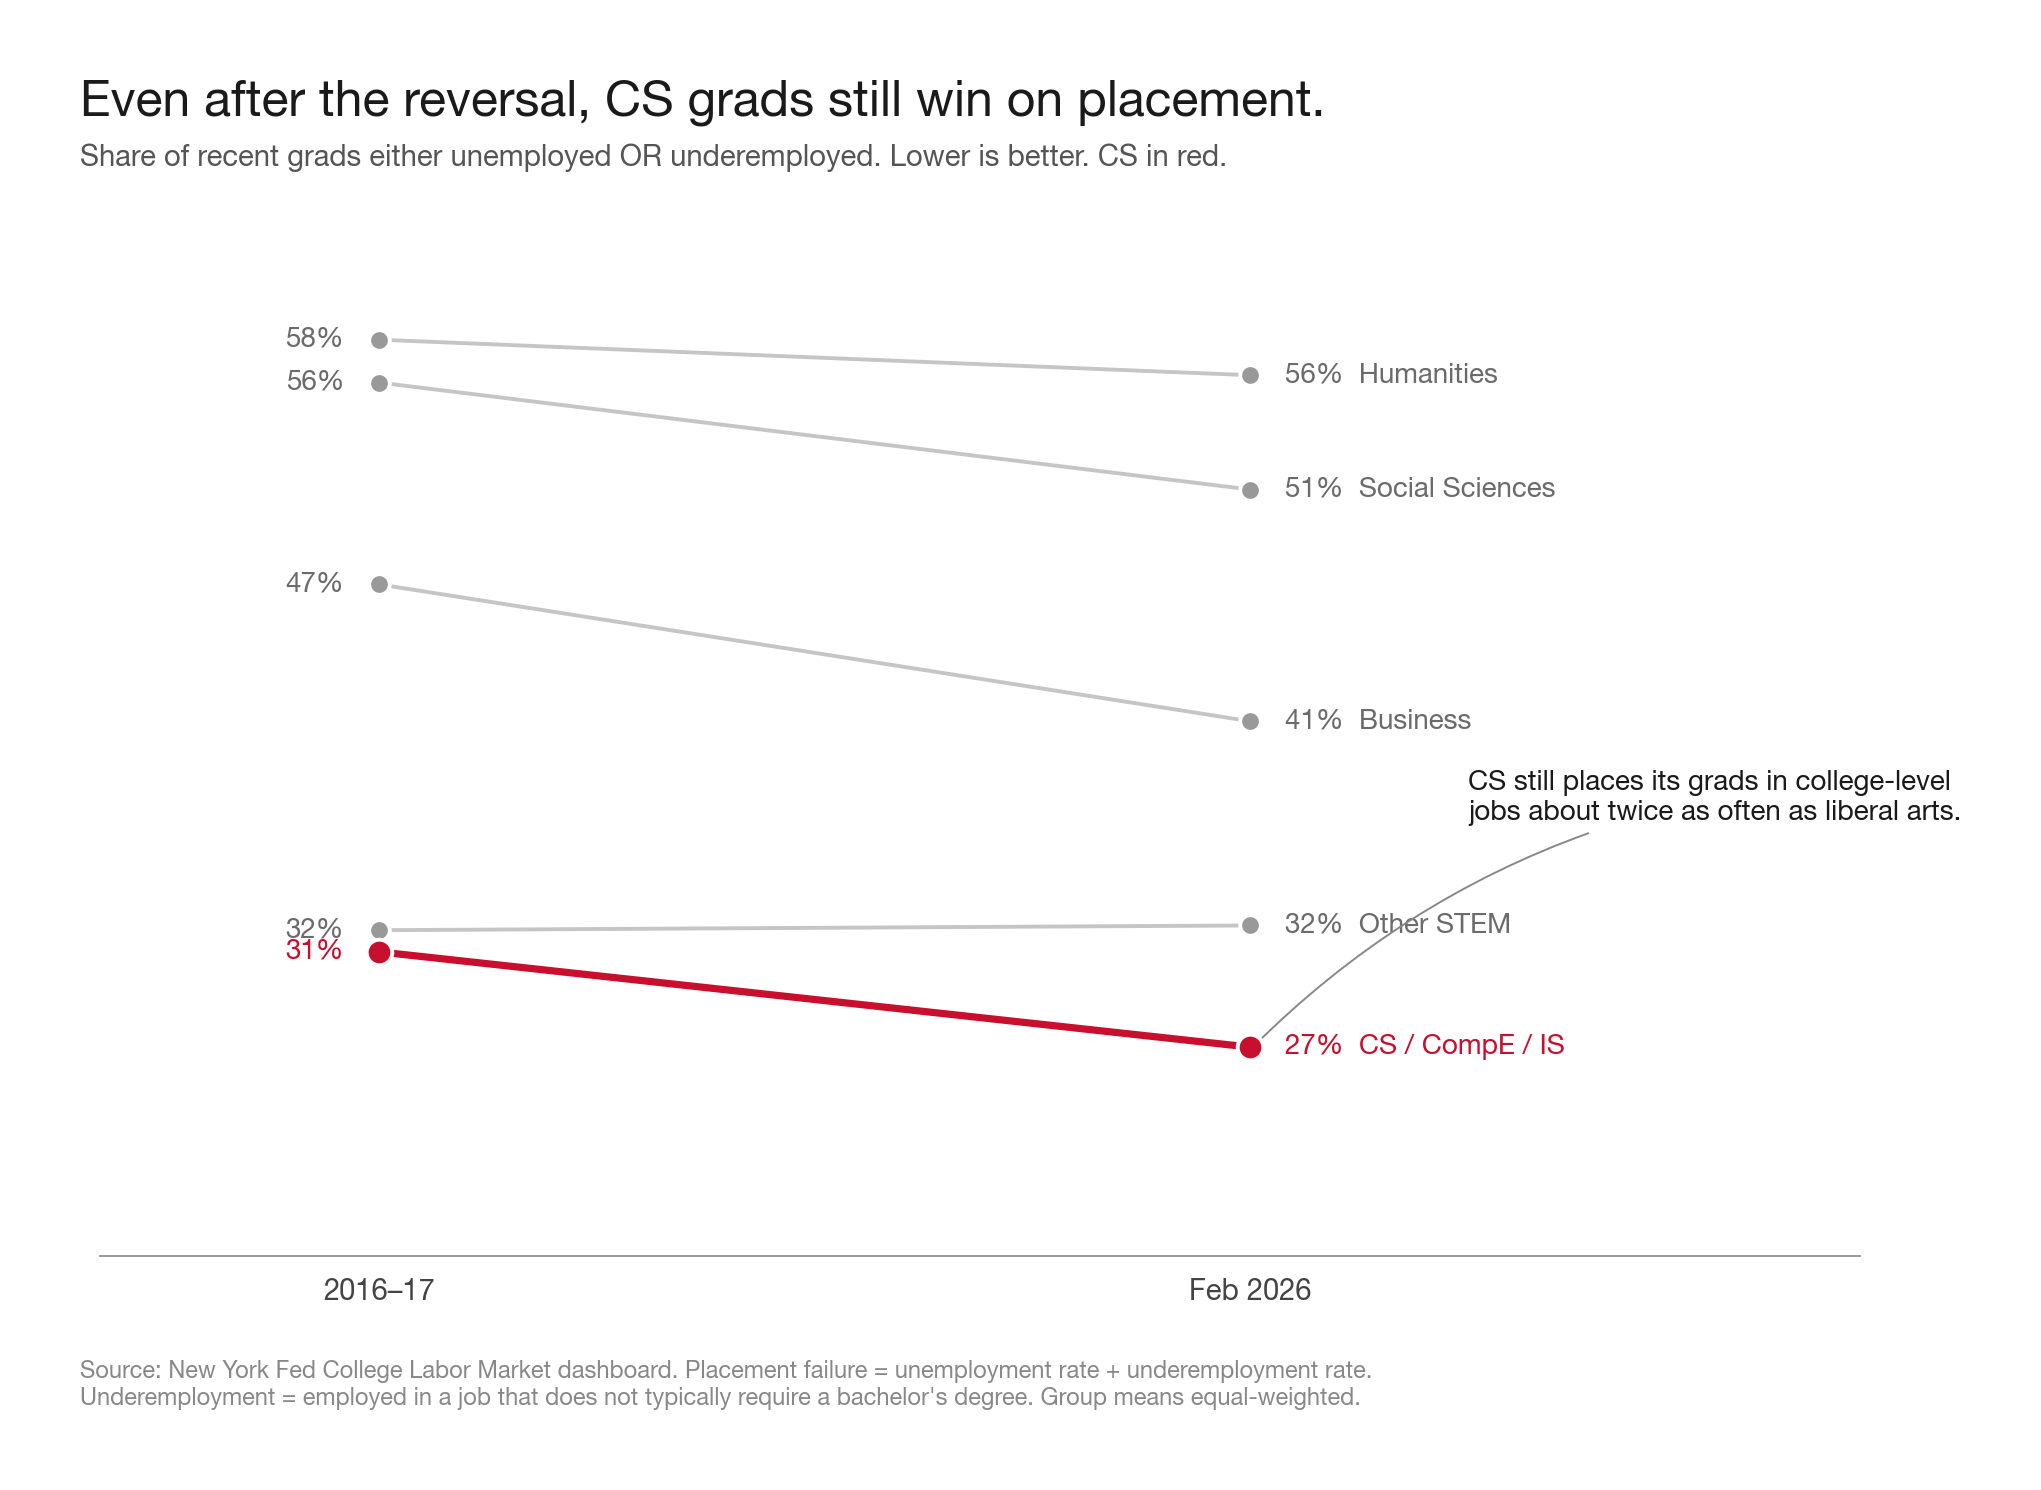
If you combine the two failure modes into a single "did the degree place this person in a college-level job?" metric:
| Cohort | Unemployed + Underemployed |
|---|---|
| CS | ~26% |
| Liberal Arts broad | ~54% |
A liberal arts new grad is roughly 2x more likely to fail at placement than a CS new grad. The "CS is now worse" framing is technically true on the narrow metric and substantively misleading on the question people actually care about.
Why it happened: supply overshoot
This is the structural piece, and it's quantified by hard data.
NCES Digest of Education Statistics Table 322.10:
- CS bachelor's degrees conferred, 2015–16: 64,402
- CS bachelor's degrees conferred, 2021–22: 108,503
- Growth: +68.5% in six years
BLS Occupational Employment Projections:
- Software developer employment, 2014: 718,400
- Software developer employment, 2024: 853,700
- Growth: +18.8% in ten years
- Projected 2024 → 2034 growth: +15.8%
CS degree production grew roughly 3.6x faster than software-developer hiring over the relevant decade. Annual CS bachelor's grads (108K/yr) now exceed total annual software-developer openings across ALL experience levels (129K/yr), and only 30–40% of those openings are entry-level-suitable. That gives a new-grad supply/demand ratio of roughly two to three grads chasing every entry-level opening.
This is a petroleum-engineering-2014 pattern. Same structural shape: four-year degree pipeline doubles chasing a hype cycle, demand doesn't keep up, new-grad unemployment spikes and stays elevated for the lag length of the pipeline (four to six years). PE new-grad unemployment hit 10%+ in 2014–2016 and didn't normalize until ~2019. The CS analog suggests elevated CS unemployment persists through roughly 2027–2029 even if tech hiring fully recovers tomorrow.
Why it happened: the layoff wave amplified it
Tech layoffs 2022–2025 cumulative: ~600K to 700K. Annual CS bachelor's cohort: ~108K. Even if only 15–20% of layoffs were junior-level engineers, that's roughly one full annual new-grad cohort's worth of experienced workers dumped into the entry-level competition pool every year of the wave.
Timing check: Meta layoffs November 2022 → Google/Microsoft/Amazon Q1 2023 → the NY Fed CS unemployment ramp begins Q2 2023 → peaks Q3–Q4 2024. The lag is exactly what you'd expect from a 12-month moving-average series responding to a labor supply shock.
The layoff wave is fading in 2026. The YTD count through May is around 102K, directionally lower than the 2023 peak. That cyclical piece should fade. The structural piece — the degree pipeline — will not.
What this means
My take:
If you're an 18-year-old choosing a major right now, CS is still the right pick by economic value: $87K early-career, 26% placement-failure vs. 54% for liberal arts, 80% wage premium. The question is whether you're prepared to spend four to eight months job-searching after graduation instead of two. The degree pays off; it just doesn't pay off on day one anymore.
If you're a labor economist, the lesson is that headline unemployment rates by major aren't comparable across cohorts with different reservation wages. The CS-vs-LA gap is partly a measurement artifact of who's willing to take a non-college job. A degree-utilization metric (unemployment + underemployment) tells a different and probably more honest story.
If you're a journalist, "CS unemployment now exceeds Art History" is a real fact and a misleading framing. The accurate one-liner is "CS grads are waiting longer for the right job, while humanities grads are settling for the wrong one." The second sentence matters as much as the first.
If you're the labor market, the elevated CS unemployment is mostly transitory and mostly structural. About two-thirds of the +2.9 pp swing reflects a supply pipeline that takes four years to adjust, and the rest is the layoff wave fading. Mean reversion to the 2017 gap is unlikely in the next two years and probable by 2029.
What would change my mind
- Direct unemployment-duration measurement from CPS microdata. If CS recent-grad weeks-unemployed is materially higher than the liberal arts equivalent, the search-strategy story is locked in. If it's not, the interpretation has to shift.
- CS bachelor's conferral trend post-2022. If CS enrollments have already started falling sharply (the labor market signal is loud), the supply correction is closer than the petroleum-engineering analog predicts. If CS enrollments are still rising, the unemployment elevation persists longer.
- The 2027 NY Fed update. If CS unemployment falls below 5% on the next print, the cyclical story dominates. If it stays at 6.5%+, the structural story dominates.
Data and methods
- NY Fed College Labor Market dashboard, latest snapshot:
newyorkfed.org/research/college-labor-market, Excel updated Feb 4, 2026; aggregate time series through March 2026. - NY Fed College Labor Market dashboard, pre-shock baseline: Wayback Machine snapshots of
newyorkfed.org/medialibrary/media/research/js/college-labor-market/datChart.txtat 2019-09-28, 2020-02-01, 2020-03-15, 2020-05-01. All four returned identical 73-major payloads, vintage labeled "2016–17 average." - NCES Digest of Education Statistics, Table 322.10:
nces.ed.gov/programs/digest/d23/tables/dt23_322.10.asp. - BLS Employment Projections Table 1.4:
bls.gov/emp/tables/occupations-most-job-growth.htm, modified Aug 28, 2025. - BLS Historical Job Growth Table 6 (2014–24):
bls.gov/news.release/ecopro.t06.htm. - Layoffs.fyi:
layoffs.fyi, live counter accessed May 10, 2026.
Group means are equal-weighted across constituent majors. A degree-share-weighted composite would tilt toward Psychology and Political Science (the largest LA fields) and likely move the liberal-arts aggregate by 0.1–0.2 pp; the headline conclusion doesn't change. Source data, computed deltas, and chart-build script are alongside this post.